
Before you go, benchmark your maturity
Get your personalized Quantum Maturity Assessment in a few minutes.


Our personalized assessment helps you understand where you are today across data, analytics and marketing technology so improvement efforts are grounded in reality not assumptions.
Start your maturity assessmentOur approach
We assess your data, analytics, and business lifestage side-by-side. That clarity guides the roadmap, the guardrails, and the velocity we take together.
We begin by listening—exploring your goals, constraints, customer realities, and the systems already in place. This perspective helps us surface the gaps that hold teams back and the opportunities hiding in plain sight.
Through structured analysis, we highlight the insights, capabilities, and decisions that will create meaningful movement. This work helps teams shift from reactive decision-making to intentional, informed action.
Whether you’re establishing new practices or elevating existing ones, we help create the data, analytics, and martech foundations needed to support consistent, repeatable growth. The goal is clarity and cohesion—not complexity for its own sake.
We translate insights into plans, workflows, and decisions that fit your organization’s capacity. You gain a roadmap that is grounded in reality: actionable today, while building toward a more capable tomorrow.
Some teams lean on us for a focused diagnostic. Others bring us in to help build or mature the function. And some benefit from ongoing, embedded partnership. Our role adapts to support your stage, ambitions, and operating model.
Quantum maturity matrix
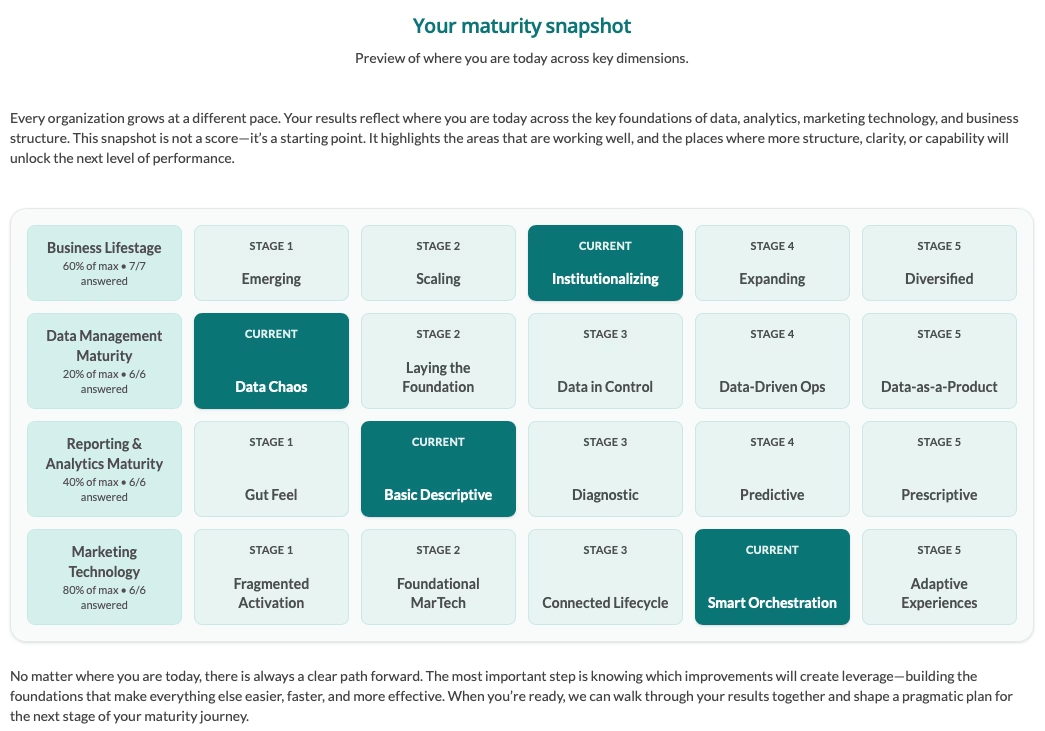
The maturity snapshot provides a clear, high-level view of where your organization sits today across key dimensions -- including business lifecycle, data management, analytics, and marketing technology.
It doesn't attempt to diagnose causes or prescribe solutions. Instead, it establishes a shared baseline: a way to see how capabilities have evolved, where maturity is uneven, and how different parts of the system relate to one another. That baseline is what makes the detail below meaningful.
The Quantum Maturity Matrix provides the structure behind the snapshot. Each dimension is broken into stages that describe how capability typically develops over time -- what progress looks like, how it tends to feel at each stage, and what changes as organizations mature.
Together, the snapshot and the matrix turn a simple view of "where you are" into a practical way to understand what that means, and how to think about what comes next.
Data Management
Overview
Is your data consistently reliable?
This dimension measures how scattered or disciplined your data is — from spreadsheets and tribal knowledge to governed, reusable data products.
Reporting & Analytics
Overview
Are you getting real insight, or just dashboards?
This dimension reflects how teams progress from gut-feel reporting to diagnostic, predictive, and prescriptive insight.
Business Lifestage
Overview
Is your structure keeping up with growth?
This dimension represents how organizations evolve from scrappy to institutionalized to diversified.
Marketing Technology
Overview
Is your stack enabling consistent, coordinated activation?
This dimension reflects how your marketing technology evolves from disconnected tools to an integrated engine for data-driven customer experiences.
Our work moves from sketch to structure. We start with messy reality — whiteboards, existing reports, and hallway conversations — and move toward simple, documented systems your team can own.
We pair strategy with delivery. You get clarity on current maturity, a plan to advance it, and hands-on support to ship the work.
After an engagement, our clients usually tell us three things
Organizations move at different speeds when it comes to turning data into insight and insight into action. Our diagnostic assessment helps you understand your current position, identify capability gaps, and highlight the most impactful next steps. It takes less than 5 minutes and provides a clear, structured view of your readiness to scale with data.
Start your Assessment